Stop running your construction business from disconnected spreadsheets, pay app trackers, AR reports, and project folders.
SiteLedger builds custom executive dashboards that give owners, executives, finance teams, and PMs one clear view of revenue, margin, cash flow, change orders, active jobs, and jobs at risk.
No ERP replacement. No forced software migration. Built around the reports and workflows your team already uses.
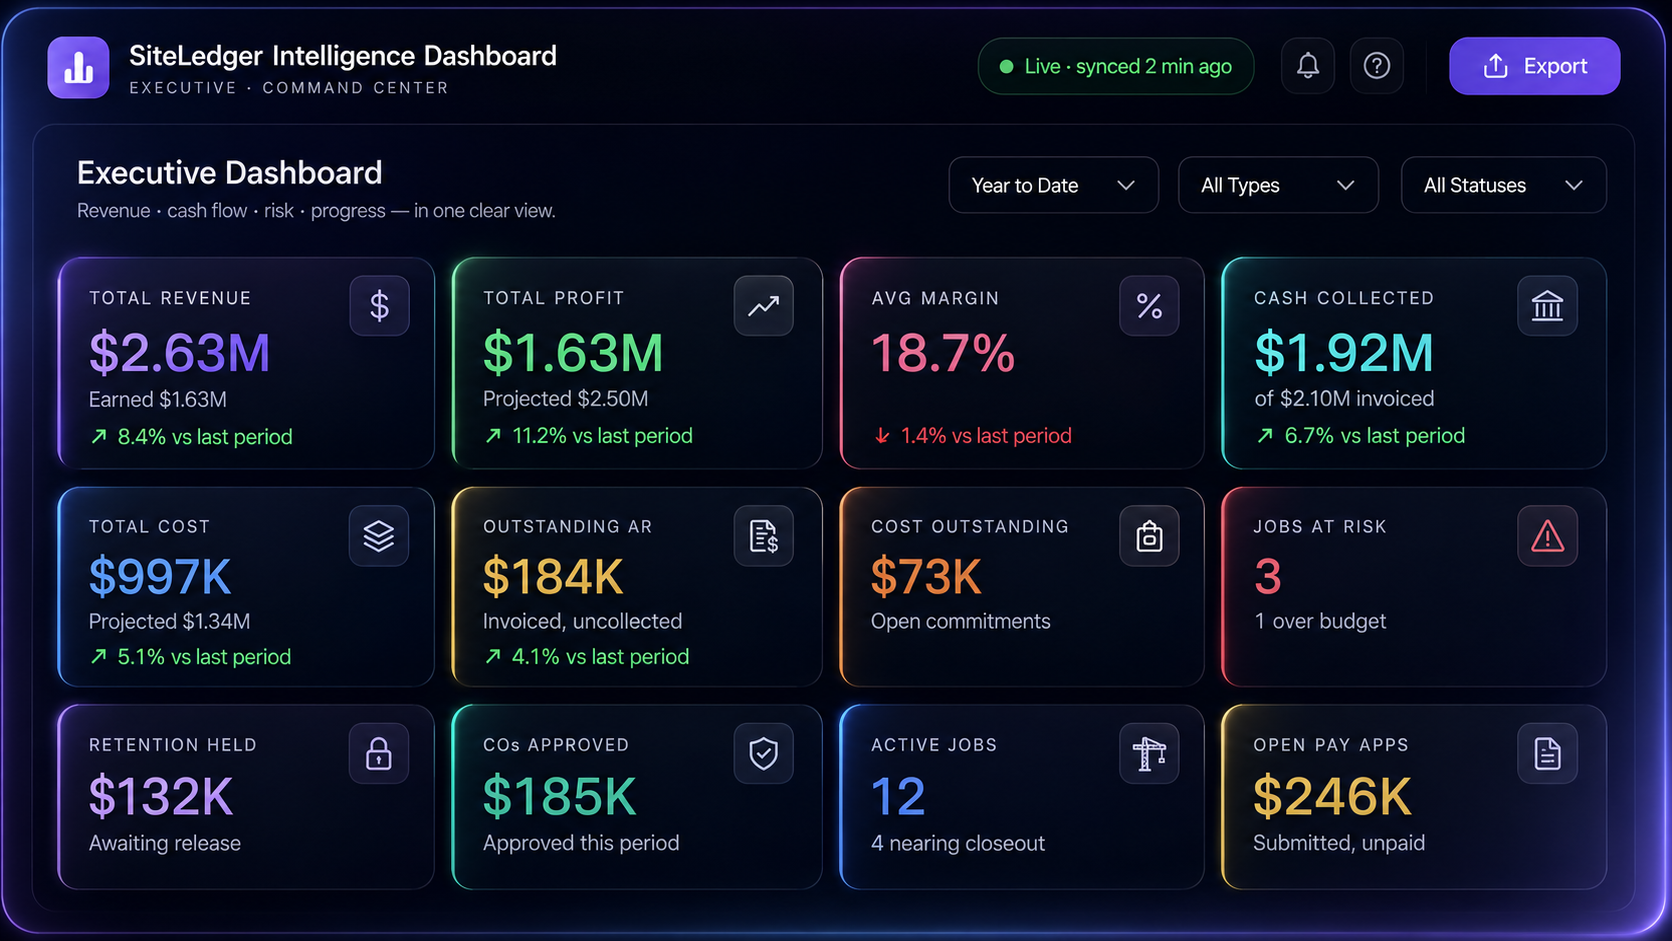
SiteLedger dashboards can be built as a standalone executive reporting tool, or paired with SiteLedger’s AI document modules later. Start with the dashboard your leadership team needs today, then add document intelligence when the workflow is ready.
A clean reporting layer for revenue, margin, AR, retention, pay apps, change orders, active jobs, and job risk — using the data sources your team already has.
Add SiteLedger document intelligence later to read bids, contracts, pay apps, CO logs, insurance certs, field reports, and project PDFs.
Not every company tracks the same KPIs. Not every team manages risk the same way. Not every leader needs the same view. SiteLedger lets the dashboard adapt to the company instead of forcing the company into a generic template.
Example KPI cards can include revenue, profit, margin, cash collected, total cost, outstanding AR, retention held, change orders, active jobs, open pay apps, jobs at risk, and cost outstanding.
Track project performance, cash exposure, draw activity, capital planning, active projects, and jobs that need leadership attention.
Track margin, AR, retention, change orders, cost exposure, open pay apps, and job profitability across the business.
Track active jobs, open commitments, project risk, pay apps, change order movement, and executive reporting in one view.
Custom KPI cards, executive summary views, finance views, and project/job performance views built around your workflow.
Change order visibility, pay app status, AR, retention, cost exposure, jobs at risk, and action items in one command center.
Exportable reporting views and an optional AI document intelligence layer when you are ready to connect PDFs to the dashboard.
Leadership gets one clean roll-up of company performance, project risk, cash exposure, and operational priorities.
Track AR, retention, cash flow, revenue, cost, margin, change orders, and job profitability without digging through disconnected reports.
PMs can see active jobs, risk flags, unresolved action items, open COs, and job-level performance in one place.
A custom executive dashboard built around your company’s KPI structure and reporting workflow.
Add SiteLedger document intelligence to turn project PDFs into risk, cost, compliance, and action-item insights.
We identify the numbers leadership, finance, and project teams actually care about.
We review spreadsheets, reports, exports, PDFs, or connected tools and map what can feed the dashboard.
We create executive, finance, project, and risk views so each team sees what matters before the final build.
We finalize the dashboard and can add an optional AI document layer when your workflow is ready.
Timeline depends on data complexity, number of views, number of KPI cards, data sources, and whether AI document intelligence is included.
Dashboard builds are scoped based on KPI count, number of views, data sources, and whether AI document intelligence is included.
Start with dashboard-only. Add AI modules later if they make sense.